


People don’t know how to use indicators. They jump into the trading business and want to become millionaire traders. However, some of the traders in Hong Kong are really smart. Instead of trading with real money, they open a demo account with the reputed broker and try to learn the art of trading. In the learning stage, the amateurs become biased with the indicators. They think these are the best tools they can find to analyze the market dynamics. But in reality, indicators are nothing but a bunch of tools. You have to use them as a filter or else things will go south fast.
Everyone must have heard about the stochastic indicator. But do you know how to use it in a professional way? Let’s learn the top 4 uses of the stochastic indicator.
Trend identification
You might be thinking that there is no way we can use the indicator to identify the trend. But if you use the indicator in the hourly time frame you can easily identify the trend. If you spot a bullish bounce in the stochastic curve after hitting the 20 levels, you can expect a bullish trend. On the other hand, when the stochastic curve rejects the 80 levels, you are going to experience a bearish trend. Be very careful with the selection of the time chart. Unless you use it in the higher time frame, the bounce will be of no use.
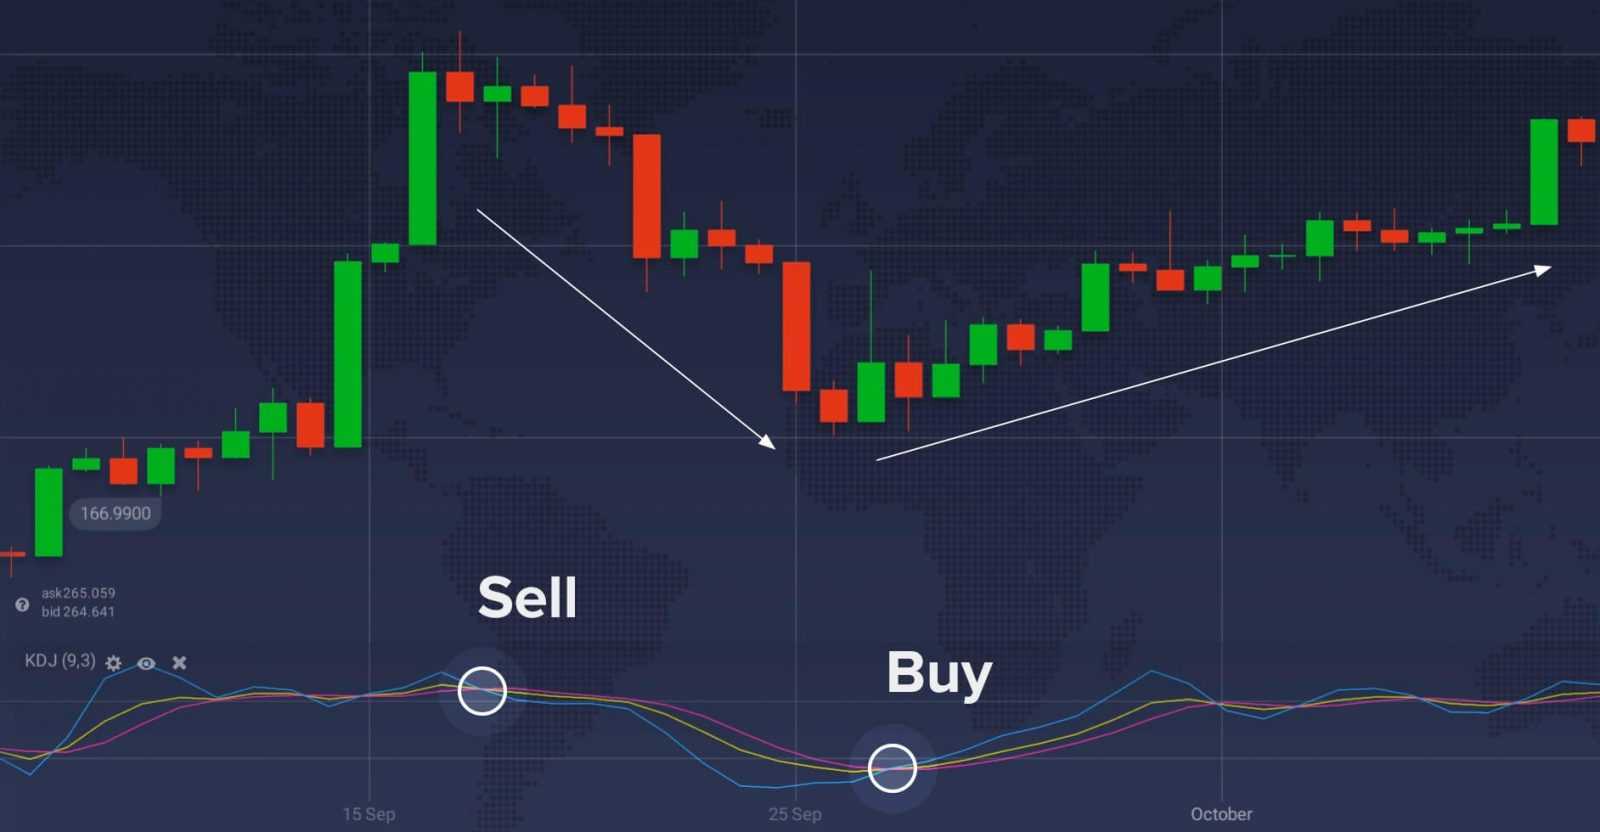
Overbought and oversold state of the market
The key purpose of the stochastic indicator is to find the overbought and oversold state of the market. If you use the premium platform provided by Saxo capital markets, you can easily do so. And the best thing about this uses it that it can be used in any time frame. The signal line reading the 20 level means the market is in the oversold state. So buying is the only option. Similarly, when the signal line touches the 80 line, selling is the best option for traders.
Using it with other indicators
By now you know the two main functions of the stochastic indicator. But do you know can also use it with other indicators? To do so, you must make use of the practice account. The best indicator to work with alongside the stochastic is the moving average. Some of you might get confused about the period of the moving average but you can always use the 100 and 200 SMA. These moving averages are going to give traders a clear idea about the dynamic support and resistance level. Once you find a trade setup at the dynamic band, you can analyze the reading of the data and try to improve your trading performance. But don’t be biased about this tool, as you will still lose some trades. Be careful about the lot size as this will determine the safety of your trading capital.
Tweaking the value of the stochastic indicator
Advanced traders can use the stochastic indicator in various forms. For that, they must tweak the value of the indicators. Though it will be a bit complicated at the initial stage once you learn to tweak the settings, you can even use it to trade stocks and other assets. Before you take it to the real market, back-test your trading method multiple times. Try to use this indicator in the higher period so that you can offset the errors caused by leading results.
Conclusion
This indicator is a very premium tool that can ease your trading process. When you learn to use the stochastic indicator, make sure you go about things in an organized way. Never rush to deal with the indicator as it will create many errors. Trading is all about precision. You should not take any steps with aggression as this will force you to lose more money.